Friday, June
25, 2004
I spent most of Thursday in a seminar given by
Edward Tufte,
the author of several seminal books in the area of data analysis and
presentation (with another, Beautiful Evidence, in the works). I enjoyed it
thoroughly and here’s what I was able to capture:
Tufte’s Grand Principles
The goal of good information design is to
minimize the amount of time spent figuring out the design of the
presentation of information (or even admiring it) and
maximize the time spent reasoning about the information. Good designs
should be as nearly invisible as possible.
Tufte: “The point of an information display is to assist thinking. Good
design is clear thinking made visible. Bad design is stupidity in action. Chart
junk is a good sign of statistical stupidity.”
My favorite Tufte term is what he calls designers brought in to make boring
numbers look interesting: “chartoonists.”
Ed’s Grand Principles of Analytical Design
- Show
comparisons (this is big theme of Tufte’s)
- Show
causality
- Show more than 2 variables, as the
world we’re trying to understand is multivariate
- Integrate word, number and image
(this is another big theme)
- Say from where the data came
- The value of an information presentation comes from
the quality, the relevance and the integrity of the content, i.e.
good design won’t fix bad content.
- Use small multiples, e.g.
showing multiple pictures of sunspots on the sun over time
- Show and embed scales of measurement
because it’s an essential part of the context
- Annotate everything and if
the audience reads ahead great, they’re reading your material
- Use proven design templates
(like those in Tufte’s books)
Tufte: “Don’t let the marketing people corrupt your presentations by
eliminating detail. Chances are, the people looking at the information know more
than the marketing people. People haven’t suddenly gotten stupid just because
they come to hear you talk. If people can read the financial tables and the
sports tables from the paper, they can get read data from you.” (The last point
assumes a good design.)
In my own work, I often remove detail for clarity, but I’m very careful
to leave enough details to keep context. I admit, it’s a fine like to walk and
hard to get right.
As a way to pack more data into a small space (and in an attempt to
secure his immortality, imo), Tufte was inspired by Galileo’s work to create a
new kind of graphic meant to be integrated into a sentence as yet another word.
He calls them ”sparklines″
(the sparkline is the graphic before each word):
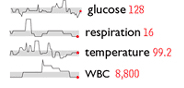
Sparklines pack a lot of information into a small space and are a cool
alternative to graphics that break the flow of thought and need to be called out
with a phrase like “as seen in Figure 3.” I have a mind to implement them in
Avalon when I get a chance.
90% Content
Tufte hates most kinds of user interfaces because they spend too much of
the already low resolution screen on “fluff,” e.g. menu bars, captions,
navigation, etc, and too little on the content itself. As an example, he showed
a screenshot of a photo display app that used only 18% of the screen for the
actual photos. He wants nearly invisible operating systems and apps and 90% of
the screen used for the content. He’s a big fan of
Google News as a way to pack in a lot of information and he’s a big fan of
scrolling. For web sites, Tufte recommends only a small set of links at the top
of each page for navigation and nothing else.
His own site is like this and I have to admit, I like it.
Design For High Resolution
Ed hates low resolution. He wants everyone to design for high resolution
to be viewed at 22 inches so you can pack a lot of information in, showing
comparisons and causality. He hates PowerPoint because it’s made to be viewed
from 22 feet and doesn’t provide a lot of room for showing dense data,
comparisons or causality. It’s far easier for humans to make judgments when they
can see everything at once instead of sequenced one slide after another (or “one
damn thing after another,” as Tufte says : ). In general, he believes everything
should be printed and that PowerPoint should only be used for showing pictures
to an art class. I see his point, but ironically, when he wrote
a paper on the problem of PowerPoint to be read at 22″, after 3 pages of him
blaming PowerPoint for sloppy thinking, I put it down in disgust. If he had had
his thoughts put together into PowerPoint-style format, I could have skipped
ahead to find his real point, i.e. low resolution makes it hard to do serious
analysis.
As a point for Tufte, when producing this summary of my day listening to
him, I’m mixing prose, images and references, but I’m not producing it in
PowerPoint. According to Tufte, 4 pages of prose is equivalent to between 50-250
PowerPoint slides and I have to admit, it would be hard to convey what I want to
say about him in a PowerPoint deck without using a lot of slides and throwing
away the subtleties. In general, I believe that PowerPoint is best for reminding
the presenter what they want to say and is very poor for the audience. Instead
of a slide presentation, Tufte recommends providing the audience 4 pages of
prose, which they read 3-5x as fast as you could say it, and then having a
conversation. Interestingly, he allowed no conversation during his own
presentation but instead talked to various parts of his books and hand-outs.
On the other hand, has anyone even read this far? Would you have gotten
farther if I’d have summarized everything in slides, skipping ahead to the juicy
bits when you got bored?
Giving Presentations
Tufte has a great deal of advice about how to prepare for and give
presentations. To prepare, you must have great content (no amount of design or
practice will fix bad content) and spend a great deal of time practicing
(especially important if you’re not using PPT to remind you what to say). When
presenting, follow these rules (these aren’t all of my rules, but I agree with
them):
- Show up early
to avoid problems and greet everyone at the door to learn their names,
introduce yourself and begin advancing your cause
-
Start talks with The Problem, Why They Should Care and The Solution
-
Never start your talk with an apology, as it just make you look
pitiful
- Use Particular/General/Particular when presenting
information, e.g. start with a particular example of something,
generalize it and then show another particular example that shows the same
general characteristics (I use this technique all the time and it’s very
effective)
- Use first person
singular only to express opinion, i.e. this isn’t a talk about
you but about a serious topic
-
Give everyone at least one piece of paper (Ed prefers a single
11″ x 17″ folded in half with 4 sides of content)
-
Knowing your content and respecting your audience is more
important than knowing your audience if by “knowing” them, you “dumb down”
your talk for them
- Avoid project
slides (aka PowerPoint or the equivalent)
-
Use humor as appropriate, e.g. hyperbole to make a point, but
don’t tell jokes. “Don’t alienate your audience because of a joke.
Alienate your audience on the merits on your content!”
-
Avoid the use of “he” or “she,” e.g. “The user, he takes his
mouse and moves it to his menu bar where he makes his
manly choice.” Use “they” instead.
-
Make sure folks know you believe what you’re saying by getting
out from behind the podium, getting close to people and use appropriate
gestures. If you don’t believe what you’re saying, they’re not going to
believe it.
- Finish early
and something good will happen. No one will ever look at their colleague,
commenting on how they wish you had gone on for another 20+ minutes.
I think that Ed has enough good things to say about how to approach the
presentation and analysis of data that I would recommend that pretty much anyone
involved in the presentation and analysis of information take the time and
attend his day-long seminar.
Discuss